0 to 80 in 30 minutes
Everyone's posting their "I built this in 30 minutes" demos. Nobody's posting the 30 hours that came after.
Read more ›
Fablemaxxing is the whole play here, and it comes down to one move: stop letting Fable do the work.
Make it the orchestrator instead, delegating every bit of execution to Opus sub-agents underneath it. Fable coordinates, Opus ships. You pay Fable’s top of market rate for a thin coordination layer, and a cheaper, faster model does the volume.
When Fable came back online this week, I finally got to test whether that is worth it. The core question: is it cheaper to have Fable orchestrate Opus sub-agents, or cheaper to just let Fable do the whole job itself?
Obviously yes. But by how much?
Everyone has an intuition here. Almost nobody has the numbers.
The only way to get real numbers is to anchor everything to time. Not vibes. Not “it felt faster.” Tracked minutes, measured against real spend and real output. That is the whole premise behind tracking time down to the block: time is the denominator that makes every other metric mean something.
So I pulled a real slice of usage. Same class of work, run two ways. Fable orchestrating Opus, versus Fable solo.
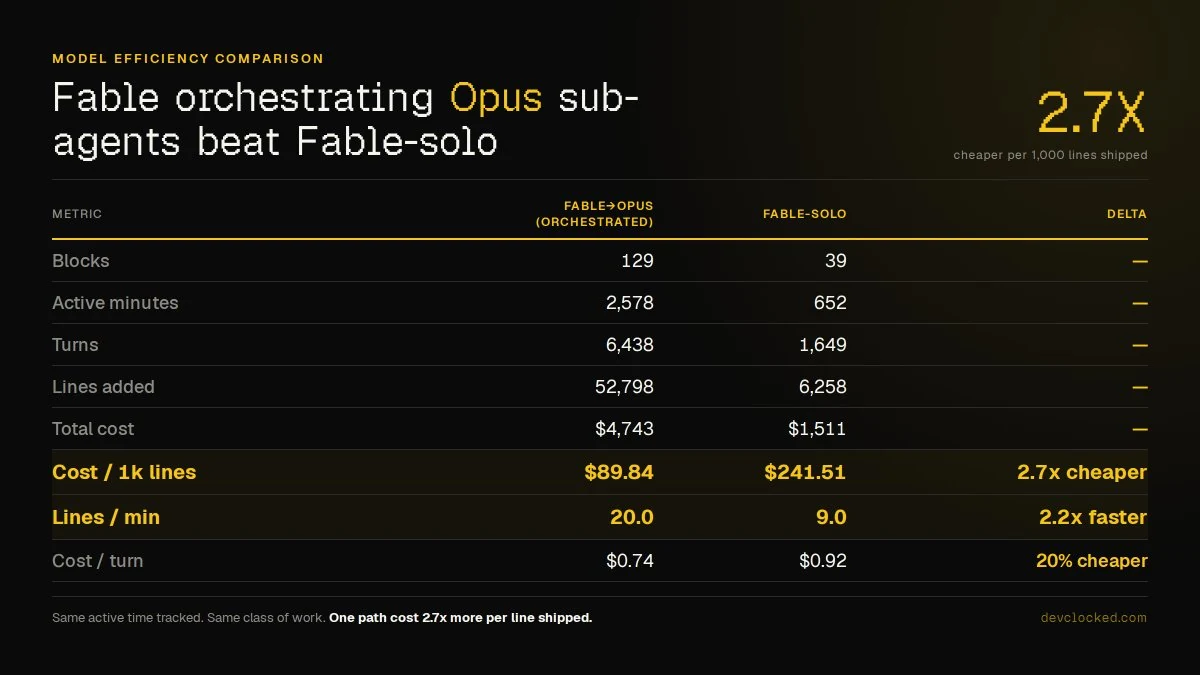
Here is what the tracked minutes said: orchestrated shipped 2.7x more code per dollar, ran 2.2x faster per active minute, and Fable’s own orchestration layer ate just 7% of the spend.
That last number is the one that reframes everything. The expensive model should be running the show, not doing the grunt work.
Two modes, same kind of work.
Fable to Opus (orchestrated). Fable acts as the orchestrator, delegating execution work to Opus sub-agents.
Fable solo. Fable does everything itself. No delegation.
Here is the full breakdown, pulled straight from tracked activity:
Two terms carry a lot of weight in this comparison. Worth defining them up front.
A block is a continuous stretch of tracked work. It runs from the moment a session starts to the moment it stops or pauses. A block can span many turns and a lot of back and forth. It is the unit DevClocked uses to group a coherent chunk of work together.
Active minutes are the cumulative wall clock time across those blocks. This is session time. Time spent actively engaged with the work. It is not the raw compute time a model spends generating a single response. It measures how long a stretch of work ran end to end, not how long any individual turn took to execute.
Orchestrated mode ran 129 blocks and 6,438 turns across 2,578 active minutes. Solo mode ran 39 blocks and 1,649 turns across 652 minutes. Both land at a similar turns per minute pace. That is what puts the two modes on comparable footing for the rest of this breakdown.
One thing this rolled up view does not show: the split between turn execution time and idle time between turns. That level of detail lives in the individual session logs, not in this aggregate. It is the natural next layer to pull. How much of each block’s active time was the model actually working, versus waiting on direction?
Look at total cost in isolation and solo mode looks like the budget option. $1,511 vs $4,743. Case closed, right?
Except that comparison is meaningless without time. Solo mode spent less because it produced dramatically less. 652 active minutes and 6,258 lines, vs 2,578 minutes and 52,798 lines. It is not a cheaper way to do the work. It is a smaller amount of work.
Normalise by tracked time (cost per line, lines per minute) and the picture flips completely. Orchestrated mode was 2.7x cheaper per line of code. It also produced more than double the lines per active minute. Solo mode was not the efficient choice. It was the slow, expensive one wearing a smaller invoice.
This is the entire argument for tracking time at the block level instead of just eyeballing spend. Raw dollars lie by omission. Time normalised metrics do not.
Here is the part that only shows up once you break the spend down against where the minutes actually went. Of the $4,743 spent in orchestrated mode, $4,421 (93%) went to Opus sub-agents. Just $322 (7%) went to the Fable orchestrator itself.
Fable’s orchestration layer is a thin tax. About 7%. The Opus sub-agents do the heavy lifting at half Fable’s output rate, $25 vs $50 per Mtok, and they still land more code per turn than Fable does solo.
So Fable solo is not paying a premium for premium output. It is paying Fable’s top of market rate to do volume work that a cheaper model could do faster, for less, under a coordination layer that costs almost nothing.
Stack the same comparison across time, code, and tokens, and the story stays consistent.
Time. 20.0 lines per minute vs 9.0 lines per minute. That is 2.2x faster per active minute. Solo mode took roughly 104 minutes per 1,000 lines shipped. Orchestrated took roughly 49.
Cost per code shipped. $89.84 vs $241.51 per 1,000 lines. 2.7x cheaper to ship the same code orchestrated.
Tokens (modelled, not directly logged). Working backward from spend and the stated $25/Mtok (Opus) vs $50/Mtok (Fable) output rates, orchestrated mode ran roughly 3,470 tokens per line shipped. Solo ran roughly 4,830. That is about 28% fewer tokens per line, or 1.4x more token efficient.
Three different axes. All pointing the same direction. Cost shows the biggest gap of the three because it compounds both the token efficiency and the raw speed advantage together.
One caveat: the token figure is derived from spend and stated rates, not a directly logged token count. Read it as modelled, not measured. The time and cost numbers are the hard data here.
Same category of work. Same instrumentation. Two completely different outcomes, depending entirely on how the work was delegated underneath. None of it is visible unless you are tracking active time against cost and output at the same granularity.
Track hours alone and these two runs look like two normal work sessions. Track time against tokens, cost, and lines shipped, and one of them is a 2.7x more expensive way to do the same job.
That gap does not show up on a timesheet. It shows up when time is the anchor for everything else.
Everyone's posting their "I built this in 30 minutes" demos. Nobody's posting the 30 hours that came after.
Read more ›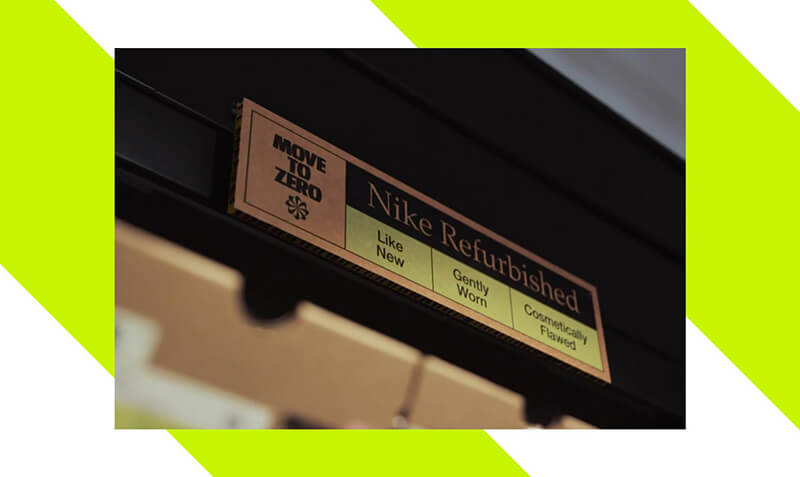
Nike are going full circle. Kinda. Nike launches the "refurbished sneaker program" aiming to give used sneakers a chance at a second life.
Read more ›
In the early days of content production, teams spent endless time and money on a single piece of content. Here's how to stop a thumb in its tracks.
Read more ›Notes on building and designing products in the agentic age, where taste is the edge. Join 20,000 people getting them, direct to your inbox.